ELECTRONIC DATA CENTER - EDC

Gazebo near Vortex

May 4, May 11 and May 18, 2012


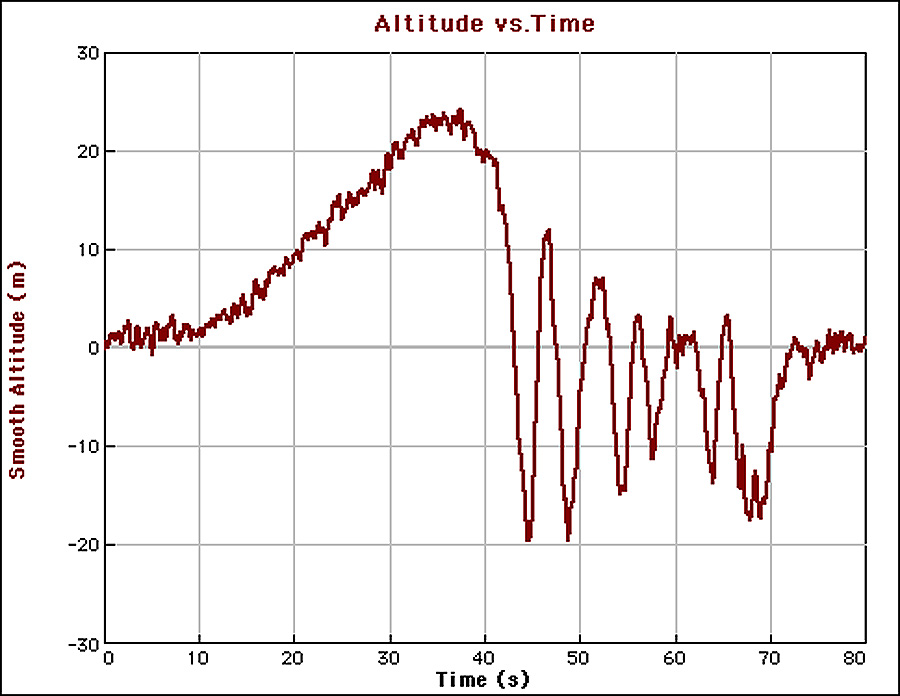
Students will be able to take an electronic data collection unit on their favorite ride to record the forces they feel. After riding they will be able to download the data and get the graphs printed for further analysis. The data will also be placed online so students can download it can work with it further. Go to the physicsday.org website to find the data.

Here are the 1-2-3’s of the process.
    1. Students should be prepared with the worksheet called "Electronic Roller Coaster" or "Electronic Drop Tower". Each sheet has several items that need attention before, during and after their ride.
       
    2. The student group will go to the EDC near Vortex. They fill out a sheet that includes their name(s), email address, teacher’s name, school and address. They indicate on which ride they wish to take the data collection equipment.
       
    3. They give the filled-in sheet and an item of value [major credit card or drivers license] to the people working at EDC.
       
    4. The workers set up an the equipment for the group so that it will collect the data they wish. The accelerometer unit will be tethered for everyone's safety and security.
       
    5. The students go to the ride, and when the ride begins (or when they wish to begin data collection) they press the [Start/Stop] button to initiate collection. Collection stops automatically at the end of a specified time, or the button can be pressed a second time to stop data collection.
       
    6. After the ride, they return the unit to the EDC where the data will be downloaded and appropriate graphs printed for them. Their security item will be returned, too.

Some additional notes:

    1. The readings are given in units of N/kg which is interpreted as the force per unit mass (F/m) acting on them, and generally will be in three orthogonal axes. If these are aligned with the student’s body, they can be translated into Vertical, Longitudinal and Lateral for interpretation. Knowing how the unit is oriented will enable the workers to assist the students in this important step.

    2. The readings are indications of forces the students felt. If they experienced a force of 9.8 N/kg, that is equivalent to the normal force of gravity. We could call the force 1-g. Similarly, a reading of 19.6 N/kg would be termed 2-g’s.


    3. The units also include an altimeter. The equipment has enough resolution that you are able to see a ‘ride profile’ where their height at any time is given in meters.
       
    4. For students to get the most out of their experience, they should identify key places in the ride and focus their attention on them. What happened to them at those places? What did the data show? Why did they feel the forces they felt there?
       
    5. If students are unable to hold the accelerometers so they are Vertical, Longitudinal and Lateral, they can create a vector sum graph (square root of the sum of the squares). This will allow them to focus on where they felt the largest and smallest overall forces during the ride.


We hope this service, which was started initially by the Physics Club at Gunn High School, will continue indefinitely. It is available for students from any high school. Teachers are also welcome to try out the equipment, which is on loan from Vernier Software and Technology.

   Updated 1/26/2012