Today's lab is designed to investigate the relationship between the force acting on a mass while it is revolving in a vertical plane and both the speed of the mass and the radius of the mass.
1. If you place a bathroom scale under your seat while riding on a Ferris wheel where would the scale measure the greatest force?
2. How will the radius of the turn affect the reading of the scale?
3. Where is the acceleration greatest on the corkscrew, how will that compare to a Ferris wheel which is traveling at a constant velocity?
4. How much will the force differ at the highest point compared to the lowest point? How will your force in the middle (half way between the top and bottom) compare to the force on the bottom?
5. Draw a free body diagram of all the forces acting on you at the top of the circle. Draw a free body diagram of the forces which act on you at the bottom of the circle.
1. Connect the force probe to Din #1.
2. Double click on the Logger pro icon. Under the experiments file, scroll down to the force sensor folder. Double click on the dual range force folder. Click on 10N Dual Range.
3. Under the experiments menu, you will find the calibrate icon. Calibrate the force sensor so that when the sensor and mass is at the top of the circle, type in +mg. At the bottom of the circular path calibrate the sensor so that it measures -mg.
4. Change the sampling to 8 seconds.
5. Balance your force probe by adding masses to the lever. When your lever is released from a horizontal position, it should not move.
6. Before spinning the device, make sure that the cord from the sensor is held so that it will not tangle.
7. Spin the device the so that it takes between one and two seconds to complete on revolution. Click collect.
8. The period of the revolution can be measured by one of two means, a stopwatch or directly from the graph.
|
Period (sec) |
Radius (m) |
Force top (N) |
Force bottom (N) |
Force side (N) |
Ftop calculated |
Fbottom calculated |
Fside calculated |
|
Constant |
|||||||
Period (sec) Radius (m) Force top (N) Force bottom (N) Force side (N) Ftop calculated Fbottom calculated Fside calculated As close to constant as possible
1. On a separate sheet of paper, attach one of your calculations for Ftop, Fbottom, and Fside. Make sure that you include Free Body Diagrams with all of your calculations.
2. Print out one graph to go along with one data calculation.
3. If you were to attach an accelerometer on to the force probe, what would the graph of acceleration vs. time look like?
4. If the device was unbalanced, what would the acceleration verses time graph look like?
5. What is the difference in force, measured in g's, when the sensors in at the top of the vertical circle as compared with the bottom of the circle.? Does the speed of the rotation matter?
6. How does the radius change the force? Give a "real life" example relating the radius to the force applied to stay in a circle as you round a corner.
7. If you are on a ride spinning in a circle, what is the minimum speed at the top of the ride so that you will not fall out of the car? (Give letters not numbers)
1. An example of a typical data set is as follows.
2. To ensure that wires from the force sensor do not tangle, have the students alternate between clockwise and counterclockwise rotations.
3. The device could be configured horizontally to measure the centripetal force of a horizontally rotating object.
4. The device could be used to study harmonic motion.
5. One could use the device to measure lever arms.
6. A accelerometer could also be attached to measure that acceleration at any given point. See below
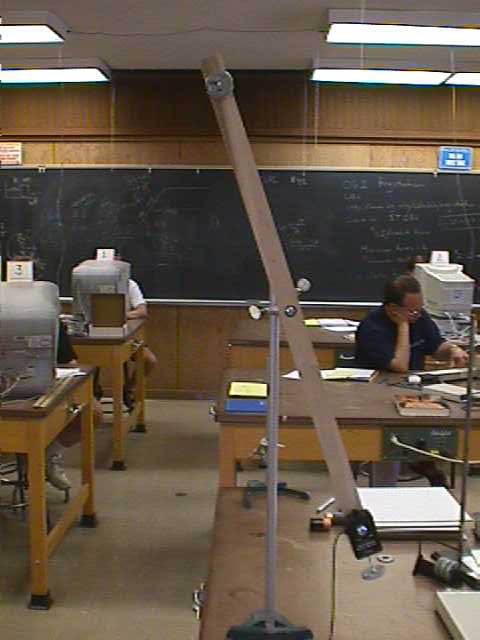
7. The device is easily constructed by drilling a 3/4 -13/16 inch hole in the center of a 1"x2"x3' piece of wood. The center bearing is a roller blade bearing which can be purchased for about 80 cents.
8. The eye hook on the force sensor was replaced by a 2" bolt and wing nut to secure the mass.