Introduction
In this lab, students will explore
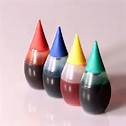
the absorption spectra of standard food colors as found in
grocery stores, then mix different colors together after
predicting what the resulting absorption spectra will resemble.
In the process of doing this lab, the basic principle being
investigated is often termed “color subtraction”.
Materials
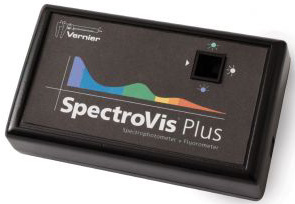
| Vernier Spectrometer | Standard Food Colors (RYB) |
| Computer with Logger Pro or LabQuest* | Water |
| Cuvettes for Spectrometer | Pipettes (suggested) |
*Original LabQuest or
LabQuest 2 can be used.
Procedure
1. Prepare mixtures of the three
basic food colors and water so they are not too dark. Mix 1 drop
per 400 mL water as a good approximation. Fill a cuvette
approximately ? full with each color mixture. Use a cap to
prevent accidental spillage. Keep your extra quantities of your
original mixtures for use later in the lab.
2. Connect the Spectrometer to your computer or LabQuest. Launch Logger Pro if using computer or the LabQuest app if using LabQuest. The default in both systems is light absorption.
3. Calibrate your spectrometer using a cuvette filled with water.
4. One at a time, collect the absorption spectrum of the colored water. Describe where absorption takes place and how this leads to the color of the mixture. Store each run and label each with the color of the mixture. Collect all three and make sure they are stored before moving on to the next step.
5. Display the graphs for the yellow and blue mixtures. What happens to the color when you mix yellow and blue? Under Analyze, choose Draw Prediction and sketch what you think the graph will look like if you mix your two colors together.
6. Then mix approximately equal amounts of the yellow mixture with the blue mixture. Making sure you’ve stored all the previous results, collect a fresh set of data and compare your prediction with the actual graph.
7. In what ways were you correct and in what ways were you incorrect? Describe the color of the mixture and graph that resulted. How does the graph explain the color you observed?
8. Continue mixing pairs of your original colors and repeat steps 5-7 for each.
9. Can you generalize anything about color mixing from the results of your lab? Determine an effective way to present the results of this lab to your instructor and then do so.
10. Clean up your lab area and return materials to the location indicated by the instructor.
C. Bakken
5/2013