|
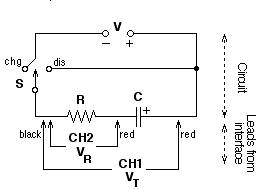
PURPOSEThe purpose of this lab is to examine the pattern of voltage vs. time and current vs. time for charging and discharging capacitors. In the process, you will examine the mathematical equation that describes the data.CIRCUIT
MATERIALS50-mF Capacitor, 47-KW Resistor, 1.5-volt cell, SPDT Switch, Wires, 2 Voltage Probes, Vernier Interface, Computer with Logger Pro software, extra capacitors and resistorsThis lab assumes use of normal Voltage Probes, VP-BTA. If you have Differential Voltage Probes, DVP-BTA, click here for a useful modification.
PROCEDURE
- Set up the circuit as shown above using a 50-mF capacitor and 47-KW resistor. Pay attention to the polarity of the voltage source and the capacitor. The switch (S) can be a mechanical switch or simply a place where you can complete the circuit by connecting a wire. This can easily be set up on a breadboard.
- Connect the two Voltage Probes to Channel 1 (CH1) and Channel 2 (CH2) on the interface. Then connect the probes to the circuit, being careful to have the two black leads connected to the same point. Connect the interface to the computer and launch Logger Pro. Click on the "stopwatch" icon and set the data collection time to 15 seconds with an interval of 0.05 sec.
CHARGING:
- Before charging the capacitor, move the switch to the position labeled "dis". Monitor the voltage on CH1, and when it reaches 0.0, you may begin this portion of the data collection. [To hurry the discharge along, touch the two ends of a piece of wire to the terminals of the capacitor.]
- Press the green Collect button to start data collection. At the same time, move the switch to the "chg" position. At the end of the 15-second data collection period, you should have one graph that remains constant at approximately 1.5 volts while the second graph line moves from a high value to a low one.
- A calculation needs to be made to determine the voltage on the capacitor (VC). You need to subtract the voltage on the resistor (VR = CH2) from the total voltage (VT = CH1).
- Under Data in the menu bar, choose New Calculated Column. Name it "Capacitor Volts", short name "Vc" and units "volts".
- In Equation, use the drop-down menu Variables to choose the voltage in CH1, "Potential 1". Then enter a minus sign, (-). Next choose the voltage in CH2, "Potential 2". This completes the equation.
- If you wish to choose the color for "Capacitor Volts", click on the Options tab. Use the drop-down menu for color. When completed, click [Done].
- A calculation needs to be made for the current in the circuit, I. You need to divide the voltage across the resistor (VR) by the size of the resistance, R.
- Under Data in the menu bar, choose New Calculated Column. Name it "Current", short name "I" and units "amp".
- In Equation, use the drop-down menu Variables to choose the voltage in CH2, "Potential 2". Then type a forward slash (/). Now type the resistance value.
- If you wish to choose the color for Current, click on the Options tab. Use the drop-down menu for color. When completed, click [Done].
- Under Insert, choose Graph. Then under Page, choose Auto Arrange. This will give you two graphs, one above the other. On one, click on the y-axis label and choose "Capacitor Volts" from the menu that appears. You may wish to autoscale the graph for best viewing. Sketch and describe the shape of this graph.
- On the second graph, click on the y-axis label and choose "Current" from the menu. Sketch and describe the shape of this graph.
- Describe the relationship between the two graphs and what they tell you is happening in the circuit.
- Go to the ANALYSIS section.
DISCHARGING:
- Under Experiment, choose Store Latest Run. Under Data, choose Hide Data Set > Run 1. With the capacitor fully charged, press the green Collect button to start data collection. At the same time, move the switch to the "dis" position. After data collection is complete, you may need to use the Autoscale button to see the complete graphs.
- Sketch and describe the shape of the Capacitor Volts graph. Sketch and describe the Current graph. Focus on the relationship between the two graphs and what is happening in the circuit.
- Go to the ANALYSIS section.
- Try other resistor-capacitor combinations as time permits, obtain the new components from the instructor.
ANALYSIS
- Focus on the Current versus Time graph. Select a section where the graph is curving smoothly. Complete a curve fit operation using a "natural exponent" regression.
- The software evaluates the data for an equation of the form y = A e-Ct + B. Record the value C for the exponent.
- Calculate the product of the resistance R and the capacitance C. Then take the inverse of this value, (RC)-1.
- The mathematical equation that describes the voltage on a discharging capacitor is V(t) = Vo e(t/RC). Note that the constant C that calculated before should be equal to the reciprocal of the RC product. Compare the inverse to the value of the exponent in your equation by calculating the percent difference. How does this difference compare to the tolerances for the resistor and for the capacitor?
- Return to the procedure and complete the discharge portion of the lab. Evaluate the resulting graphs using the same procedure as before, except focus on the capacitor voltage (VC) versus time.
- If your instructor directs, repeat the experiment using different values for R and C.
DATA
|
Resistance, R |
|
|
||
|
Capacitance, C |
|
|
||
|
|
Charge |
Discharge |
Charge |
Discharge |
|
Exponent, C |
|
|
|
|
|
Product, RC |
|
|
|
|
|
Inverse RC, (RC)-1 |
|
|
|
|
|
% Difference |
|
|
|
|
MORE ANALYSIS
- If we examine the general equation for exponential decay, we could substitute the value Vo/2 for V(t), and solve for the time it takes for the voltage to drop to half its former value.
V(t) = Vo/2 = Vo e-t/RC 1/2 = e-t/RC
ln (1/2) = -t/RC
t1/2 = -RC ln (1/2) = 0.693 RC
- Now go to your data for the capacitor voltage during discharge. Pick a point near the highest voltage, recording the voltage and time in the following table. Then scroll down until you get to a voltage that's close to half of the original value. Record the new voltage and time values. Repeat, going down in halves.
Voltage Time t1/2
- Subtract the first time from the second, the second from the third, etc. to yield the half-voltage time. When finished, calculate the average half-voltage time.
- What you have just done is to demonstrate that capacitors discharge in a mathematical pattern that is identical to the half-lives that radioactive materials demonstrate. Namely, that in equal times, half of the original decays away, then in an additional equal time, half of that decays. And right there on your lab bench!
- Compare the average time your capacitor took to drop to half its voltage value with the theoretical 0.693 RC. How does the percentage difference compare to the tolerances of the resistor and capacitor?
If you have differential voltage probes (DVP-BTA), the circuit can be set up as shown here:
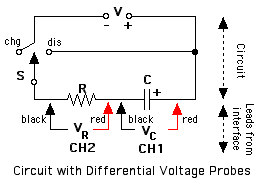
If you use this modification, there is no need to calculate the capacitor voltage, Vc. You may wish to go to the "Potential 1" column in the data table, double-click on the title, and change it to "Capacitor Volts". Then go on with the lab after deleting step 5.
Click here for MS Word version for computer - capacito.docClick here for pdf version for computer - capacito.pdf
Click here for MS Word version for calculator (EasyData) - capacito-easy.doc
Click here for pdf version for calculator (EasyData) - capacito-easy.pdf
Click here for a short page of information for teachers - teacherinfo.doc
* Click here for a simplified version for LabQuest - capacito1-LQ.html
* Click here for a full version for LabQuest - capacito2-LQ.html
* Word and pdf versions are available for LabQuest on those respective pages.
C. Bakken
November 2009