 Theory
Heating of objects that are placed in the sun takes place along their surface. Changing the color of an object may affect the rate at which it absorbs sunlight and thus the rate at which it heats up.
Purpose
Compare the heating rate for objects of different color.
Equipment
Temperature probe(s), data collection platform, soda cans painted different colors, water
Procedure
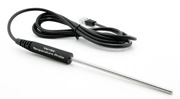
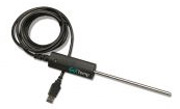
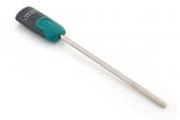
- Plug the temperature probe into your data collection
platform. When the software launches and gets connected to the
temperature probe, it will set up a graph of Temperature
versus Time.
- If you have Logger Lite, Logger Pro or a LabQuest, set the
time for data collection to 600 seconds. A rate of 1 sample
per second is a good rate but it can be set slower like 1
sample per 5 seconds.
- Pour room temperature water into the can, filling it close
to overflowing. Place the can in the direct sunlight. Place a
temperature probe as close to the center inside the can as
possible and hold it there. (You could use a ring stand to
hold the probe.) Wait approximately a minute for the probe to
adjust to the temperature of the water. Consider blocking the
sunlight while the probe is adjusting to the water
temperature. Once the temperature is stable, begin data
collection.
- When data collection is complete, remove the temperature
probe from the can. Dispose of the warm water carefully.
Return the can to the place indicated by the instructor and
obtain a second can that is a different color. This will be
used for your second run.
- Store your data by clicking or tapping on the file cabinet
icon, or choosing "Store Latest Run" under Experiment.
- Fill your second can with water. Repeat Steps 3-4.
- Repeat Steps 3-4 with a third can, if it is available. When finished, return the equipment then answer the questions in the Analysis section.
Analysis
- Did the cans heat at a steady rate? Did they heat fastest at
the beginning or at the end? How did you determine your
answer?
- Compare the graphs from your cans. Which heated the fastest?
Which heated slowest? How did you determine this from your
graph? In the Data Table below, record "fastest", "medium" or
"slowest" for the Heating Rate of each can.
- Determine how much the temperature changed for each of your
trials. Record the values in the data table.
- Formulate a reason why you think one heated faster than the
other. Think of other situations where objects heat fast or
slow depending solely on their color. Explain these situations
as part of your report.
- If you were going to rely on the heat you absorbed from sunlight, what are some changes you might make in your experiment to get a greater heat gain? Explain why you think this would work. Describe an experiment to test your idea.
Data Table