In this lab, one or more of a variety of forces will be applied to a dynamics cart. In one case, a beaded chain passing over a pulley will supply the force to move the cart. In another, a stretched spring will apply the force to the cart. And in another a rotating cylinder with a weight will turn and apply force to the cart. A quick examination of these situations will show that the force in each is not uniform, and the behavior of the cart should mirror this lack of uniformity.
A special feature of this lab will be comparing the motion readings recorded using as many as four different technologies to compare their relative usefulness, strengths and weaknesses.
Purposes
* Characterize the nature of the non-uniform force being applied
* Collect motion data and characterize the nature of the resulting motion
* Apply modeling techniques to the analysis of this motion
* Develop an understanding of what the derivative of acceleration vs. time graph means.
* Compare the data collected by multiple technologies
* Compare the motions using different non-uniform forces
Materials Used
Dynamics Track
Dynamics Cart with or without Motion Encoder
Data Collection interface such as LabPro, LabQuest Mini, LabQuest
Data Analysis software such as Logger Pro, Video Physics, etc.
Motion Detector
Video recording device such as Digital Camera or smart device
Super Pulley with Photogate
Beaded Chain
Long spring w/ low value of k
Cylinder mounted vertically as shown later
Key Questions
* What forces are acting on the cart in this experiment? If the cart accelerates, which force(s) are responsible for the net force acting on the cart?
* As the cart moves, how do you expect the net force to change? How will this affect the motion of the cart? Sketch what you think an acceleration vs. time graph would look like. Explain the shape of your graph.
Setup
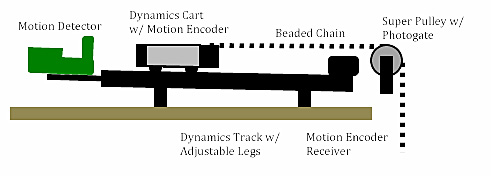
In the diagrams that follow, three situations are illustrated. In the first, with the beaded chain, three different technologies are shown although any number may be employed. The one not shown is video recording and subsequent video analysis. The data collection options are not shown in the second and third situations.
Beaded Chain:
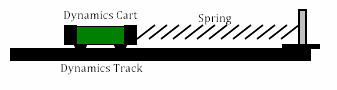
Stretched Spring:
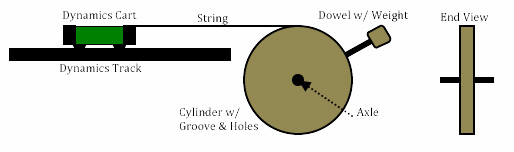
Rotating Cylinder:
Procedure
1. Set up the Dynamics Track and adjust the legs until the cart will move with a constant velocity towards the end of the track when given a slight nudge. Use either a Motion Detector or Motion Encoder to monitor the motion until you achieve constant velocity. Note: This step compensates for the small amount of friction that is inherent in the Dynamics Cart and Track. (The slope of the track in the diagram above is exaggerated.)
2. Set up the data collection devices that you are going to use, using one collection system such as LabPro, LabQuest or LabQuest Mini for each. Also arrange for collecting video data that is able to capture the full run of the cart. One suggestion is to include a “target” on the side of the cart like the one to the right so it is easy to pick out when doing video analysis.
3. Setup the various data collection methods and test them to make sure they are working successfully. If possible, coordinate the release of the cart so that all of them can be used to record the same trial.
4. With all of the data collection groups ready, set the cart at its starting point. Start data collection then release the cart or give it an initial nudge.
5. Examine the data recorded by each of the groups to determine if all of the technologies worked successfully. If they did, store the data from this run, then repeat so you have at least two runs. Move on to the Analysis section.
Analysis
1. Examine your plot of position vs. time. Characterize the shape of this graph and write a general statement on what it indicates about the motion of the cart.
2. Examine your plot of velocity vs. time. Characterize the shape of this graph and write a general statement on what it indicates about the motion of the cart. Was the rate of change of velocity constant? If not, what does this indicate about the acceleration of the cart?
3. Examine your plot of acceleration vs. time. Characterize the shape of this graph and write a general statement on what it indicates about the motion of the cart. If it is not constant, how could you go about learning more about the changes in acceleration?
4. In your data collection device, computer or LabQuest, create a calculated column of the derivative of the acceleration. This quantity is called “jerk”. How does this quantity behave in your lab?
5. Compare the results from your two runs. If there were large differences, try to determine what caused them and then repeat a third time trying to eliminate those factors.
6. Based on your analyses above, write a complete statement to describe the motion of the cart in this lab.
7. Now compare the data collected by different technologies. Which of these gave you the best overall data to work with in your analysis? Why do you single out this one? Determine by discussion with the other members of your team why you think the other technologies, while useful for many experiences, may be less adept at this situation.
Extension
If your bead chain is long enough, have it strike either the floor or a box or chair so that the leading end stops. This won’t stop the cart, but will change the net force as the beads that stop won’t pull on the cart any more. How will this affect the graphs? Try it.
For the Teacher
A similar lab was written up by one of the participants in the PhysLab program in Palo Alto during summer 1997, Al Lychy. A direct link to that version is:
http://cbakkennet.ipage.com/physlab/plab97/labs/ajlychy/teachermenu.htm
This lab was also re-written in part for the author’s Weblabs collection. A direct link is:
http://cbakkennet.ipage.com/weblabs/nonuniform.html
It is instructive to read through those versions of the lab, and although it may not answer every question, it may help the students and instructor to better understand what is being asked and what the resulting graphs may resemble.
Perhaps you might choose to have as many as four different teams of students, each responsible for one of the different technologies. It is possible to use 1) standard Motion Detector recording, 2) Super Pulley + Photogate recording (Smart Pulley), 3) Motion Encoder recording, and 4) video recording for use with either Video Physics or video analysis within Logger Pro.
Use of LabQuest 2 will allow a single collection, such as with the Motion Encoder, to be shared wirelessly to all the students working on the project. So each student could go home with a full set of data from this lab.
My thanks to Roger Larson and Larry Dukerich for reading the early versions of this lab and giving me feedback that improved the final product immensely.
Click here to download a Word version of this lab: nonuniform2.doc
C. Bakken
2/08/15