To observe and explain an
acceleration vs. time graph when an object, in this case a
LabQuest 2 interface, is given an initial push and then allowed
to slide to a stop.
RESEARCH QUESTIONS
1. The area under the curve of an
a-t graph represents the change in velocity of an object. How
does the change in velocity as the LabQuest 2 is accelerated
compare to its change in velocity as it coasts to a stop?
2. Given the mass of the LabQuest 2 to be 350 grams, what is the force of sliding friction between the LabQuest 2 and the table?
3. What is the coefficient of friction between the LabQuest 2 and the table?
2. Given the mass of the LabQuest 2 to be 350 grams, what is the force of sliding friction between the LabQuest 2 and the table?
3. What is the coefficient of friction between the LabQuest 2 and the table?
EXPERIMENTAL DESIGN
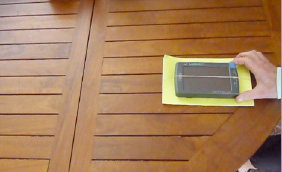
Figure 1.
Materials:
LabQuest 2, pamphlet*, rubber band*
Sensor: Internal X-axis Accelerometer
Mode: Time Based Sampling Rate: 100 samples/s Duration: 2.0 s or longer
* The rubber feet on the LabQuest 2 prevent it from sliding smoothly across the table. Thus, in this photograph, the LabQuest 2 is connected to the pamphlet with a rubber band that goes through the middle of the book and it’s the friction between the pamphlet and the table that operates to slow down the sliding LabQuest 2. Another option is to cover the rubber feet with pieces of smooth tape.
EXTENSIONS
1. Verify that the value you
calculate for sliding friction is an accurate one.
2. If you have multiple LabQuest 2’s piled up on one another, or added masses piled on the original LabQuest 2, how does this affect your results?
3. Repeat the same experiment using a smart phone or tablet and appropriate software to permit calculation of the area under the acceleration vs. time graph.
4. Devise a way to repeat this experiment using computer-based data collection or an original LabQuest. What sensor would you use? Would this give you similar results or different results? Try it.
Idea contributed by Roger Larson from STEM Solutions in Boulder, CO. Additional ideas and editing by Clarence Bakken.
December 2013
Click here for MS Word version
Click here for pdf version