 Purpose
Measure speeds using the slope of a Position vs. Time graph.
Research Questions
How closely can you move your hand at designated speeds?
Setup and Materials
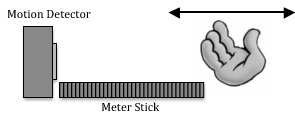
Motion Detector, interface unit, meter stick
Sample rate = 20 Hz, Duration = 5 s.
Procedure
Practice moving your hand along a meter stick at speeds of 10, 5 and 2 cm/s and then use the Position vs. Time graph produced with a Motion Detector to monitor your motion. The slope of your graph line represents your average hand speed. Calculate the percent error between your target speed and the measured speed.
Data Table
|
(cm/s) |
(cm/s) |
|
|
|
|
|
|
|
|
|
|
|
|
|
|
|
|
|
|
|
|
|
Conclusion
(Respond to your research question, include results, and discuss error)
Suggestions for Further Research
Try measuring with hand speeds of 50 cm/s, 20 cm/s or even 1 cm/s
Click here for Teacher Notes related to this lab
Click here for the original MS Word version of this lab
Click here for the pdf version of this lab
Thank you to Roger Larson, the author of this lab. The webmaster has taken a few liberties with re-formatting Roger's original document and changing the photo.
Posted 1/21/10