BUNGEE CART (CBL)
PURPOSE:
In this lab we will investigate the effects of different methods
of stopping a moving cart. We will also do a mathematical analysis,
looking at the impulse delivered to the object and the resulting
change in its momentum.
APPARATUS:

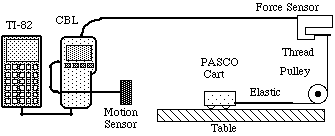
PROCEDURE:
- Connect the CBL interface to the TI-82 using the Link Cable.
Plug the Motion Sensor into the SONIC port on the CBL. Plug the
Force Sensor into CH1, using the DIN-CBL adapter. Turn the CBL
on, turn the TI-82 on.
- Mount the Motion Sensor as far away as practical from the
cart.
- Connect one of the elastic cords (or rubber bands) between
the cart and the end of the thread. The upper part of the thread
should be vertical, pulling straight down on the Force Sensor,
and the lower part should be parallel to the table.
- Run the program BUNGEE. Follow the directions
on the screen. Move the cart until it is near the pulley, taking
care to keep the elastic and thread from knotting or jumping off
the pulley. Push the cart towards the Motion Sensor when you hear it
begin clicking.
- Once the data is collected, a menu will appear. Either of
two graphs can be drawn, Force vs Time or Velocity vs Time, or
both. The program has been designed to "auto-scale",
meaning the graph will expand so the data will fill the entire
screen.
- Examine each of the individual graphs. Can you determine where
the cart reached the end of its free roll and began stretching
the elastic cord? (Motion is negative going towards the sensor,
while motion away from it is positive.) Can you see where the
cord begins to stretch, exerting increased force on the Force
Sensor? If this isn't clear, get help from the instructor.

- The function "TRACE" is automatically chosen with
each graph. On the Velocity vs Time graph, choose a place where
the velocity is turning from negative to positive. Move the blinking
cursor to that point and record the values T1
and V1. Move the cursor to a point near where
the velocity has its maximum positive value, then record T2
and V2.
- Return to the menu by pressing [ENTER] twice and select "Integrate".
When asked, give the values for T1 and T2,
which will be the limits for integration of the force graph. The
numerical integral, the area under the graph from T1
to T2, is the impulse given by the elastic
cord during that time interval.
- Repeat the experiment with different elastic cords or combinations
of elastic cords. Be aware of differences in duration of the impulse,
size of the force, etc. Be prepared to discuss these differences
and why they're different.
DATA:
Mass of Cart: ___________________
| Trial |
T1
sec |
V1
m/s |
T2
sec |
V2
m/s |
Area (I)
N s |
Dp
kg m/s |
| 1 | | |
| | | |
| 2 | | |
| | | |
| 3 | | |
| | | |
| 4 | | |
| | | |
| 5 | | |
| | | |
ANALYSIS:
- Calculate the change in momentum for each run. Enter the results
in the table.
- Theory states that the change in momentum is equal to the
net impulse. Does your data support this? What sources of error
could account for any differences?
Click here to get the original MS Word document, bungee.doc. It is in Word 6.0 for Mac format.
Click here to get the UUEncoded CBL program, BUNGEE.UUE. It is for TI-82, and once it is
decoded, it can be converted to the correct format for other calculators
using the appropriate TI-Graph Link program.
Updated 5/16/98


