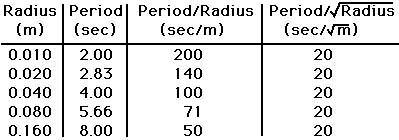

Now we will look at a pattern that uses the data table again.
Direct
Square
Inverse
Square Root
|
The table of data from the Direct Relationship has been expanded below by first multiplying each pair of data points and then dividing them (Dependent divided by Control). Note that of these two processes, only one - the quotient - yields a constant value. Thus the Constant Ratio technique |
 |
|
The Inverse Relationship also has a Constant Ratio, but in this case, the ratio must be the Period divided by the Inverse of the Frequency. |
 |
|
The Square Relationship is not a straight line plot, nor does the factor change the same for both variables. However, if one takes the ratio of the Dependent Variable to the Square of the Control Variable, the ratio is constant. |
 |
|
The Square Root Relationship is not a straight line plot, nor does the factor change the same for both variables. However, if one takes the ratio of the Dependent Variable to the Square Root of the Control Variable, the ratio is constant. |
 |
This technique is the least used of the four presented. However, it can be powerful, allowing you to check from your data table whether a relationship is one of the four we have been studying.We recommend that you go on to the Self Check before advancing on this web site.
Updated August 2001