We also note that this general process can be used to take data in other places, including go-cart tracks, bungee jumping, traveling carnivals, or even the local playground. Taking an accelerometer in a high-speed elevator is also instructive and can yield some great physics.
Vernier Software & Technology has produced a virtual booklet for people who wish to take data at an amusement park. It can be obtained from the Vernier web site, or it can be downloaded from this site by clicking here. You will need Adobe Acrobat Reader to view the file. Updates and additions to the file are ongoing with the latest to debut mid-March 2007.
The images in this article are small. If you click on the image, you will get a larger image so you can see the details better. If you have questions, write the author, our physicsday.org webmaster.
The "Results" link below goes to a section of the web site where we showcase a number of data runs in a Graph Matching activity. Great America has been very cooperative with the Physics Day Steering Committee, and we appreciate their willingness to share this data with people interested in what happens to them while on amusement park rides.
|
|
|
|
|
|
|
|
BACKGROUND
Texas Instruments developed a battery-powered Calculator Based Lab Interface (CBL) that works with many of its graphing calculators. The CBL uses sensors developed and sold by Vernier Software & Technology in Portland, Oregon.
Vernier developed a single axis accelerometer, then a 3-axis accelerometer. When accelerometers and CBL's are combined, a flexible, portable data recording system for the amusement park emerges.
The next step in this evolution was CBL2 and LabPro, faster interfaces with more data storage capacity than the original CBL. Because some parks and rides forbid the carrying of instruments in students' hands, a new product was developed, the DataVest. A photo below shows one of the prototypes. This vest was seen on the MSNBC program "Scream Machine" and was also shown on the TLC program "Extreme Machines".
The latest stage of evolution is the WDSS - Wireless Dynamics Sensor System. This device contains a 3-axis accelerometer, altimeter and force sensor. It can collect data at a very rapid rate and store over 200,000 samples. Programming and downloading of data is done with a Bluetooth-enabled computer. In addition, WDSS can collect multiple runs of data.
PASCO Scientific, a major physics equipment supply company, also has a line of hardware and software that can be used for collecting and analyzing data at amusement parks. While this document discusses the Vernier options, PASCO users have parallel data collection routes to obtaining data on the rides.
EQUIPMENT
HISTORICAL
 The
photo to the right shows the case that protected the original
CBL unit during shipping. We've customized it by cutting out
openings in the cover to allow access to the display and to the
buttons. Instructions to hold the case securely in a fixed
orientation relative to the riders and when to push the
[TRIGGER] button are taped to the front of the
case.
The
photo to the right shows the case that protected the original
CBL unit during shipping. We've customized it by cutting out
openings in the cover to allow access to the display and to the
buttons. Instructions to hold the case securely in a fixed
orientation relative to the riders and when to push the
[TRIGGER] button are taped to the front of the
case.
An additional opening could be cut in the end of the case where the Link Cable enters the CBL. If this were done, the case wouldn't need to be opened when programming the CBL prior to gathering data.
 Inside
the case, the CBL unit is held in its original position by the
custom foam, but some cuts have been made in the foam to allow the
accelerometer leads to be inserted into the CBL. A 3-axis
accelerometer is shown along with the three DIN/CBL adapters
needed for it to connect to the CBL.
Inside
the case, the CBL unit is held in its original position by the
custom foam, but some cuts have been made in the foam to allow the
accelerometer leads to be inserted into the CBL. A 3-axis
accelerometer is shown along with the three DIN/CBL adapters
needed for it to connect to the CBL.
When the case is closed, students can still see the display and have access to the buttons.
RECENT
 Here
we have substituted a LabPro for the CBL. LabPro is a
faster interface, with more memory and four times the ability to
discriminate data. We found the LabPro fits nicely into the CBL
case as shown here, as will the CBL2. Extra cuts in the
foam have to be made to provide access to the input jacks, and a
larger opening in the cover was cut to give access to the
[START/STOP] button which is at the top of the
LabPro.
Here
we have substituted a LabPro for the CBL. LabPro is a
faster interface, with more memory and four times the ability to
discriminate data. We found the LabPro fits nicely into the CBL
case as shown here, as will the CBL2. Extra cuts in the
foam have to be made to provide access to the input jacks, and a
larger opening in the cover was cut to give access to the
[START/STOP] button which is at the top of the
LabPro.
Note that programming of CBL2 requires a calculator, while a LabPro can be programmed with either a computer or a calculator.
When we use the LabPro with the accelerometer, we are no longer limited to 512 data points. Most often we gather about 1000 data points per run. This permits us to collect data points closer together in time allowing more detail to be recorded during the ride.

 LabPro
has 4 analog inputs. In practice, we equip the LabPro with a
3-axis accelerometer and a barometer. We can collect over 1000
points from each of these sensors plus record time. We hold the
accelerometer on the calculator cradle that comes with LabPro or
CBL2 using velcro. Rubber bands are placed over the body to hold
the leads in place, and the whole unit now rides safely in the
pouch of the vest. The barometer is placed in a pocket to the
lower left-hand side of the main pocket, and the lead is brought
up through a button hole in the side of the main pocket. This
makes a clean setup for use at the park.
LabPro
has 4 analog inputs. In practice, we equip the LabPro with a
3-axis accelerometer and a barometer. We can collect over 1000
points from each of these sensors plus record time. We hold the
accelerometer on the calculator cradle that comes with LabPro or
CBL2 using velcro. Rubber bands are placed over the body to hold
the leads in place, and the whole unit now rides safely in the
pouch of the vest. The barometer is placed in a pocket to the
lower left-hand side of the main pocket, and the lead is brought
up through a button hole in the side of the main pocket. This
makes a clean setup for use at the park.
The DataVest is shown to the right with the set of equipment described above.
While the accelerometer is used to study the forces on the ride, the barometer's role is one of gathering a ride profile. Atmospheric pressure drops as altitude increases at approximately 1 mm Hg equivalent per each 11.1 meters. By recording the pressure of the barometer in mm Hg during the run, we get an upside down profile of the ride. Subtract the individual pressure readings from the maximum then multiply by 11.1 and we get the relative height throughout the ride in meters.
The LabPro is programmed directly with a computer using a serial or USB cable. The LabPro is set up to gather data remotely and after the data is gathered, the LabPro is returned to the computer for downloading of the data. The program Logger Pro makes this process very streamlined and reliable.
CURRENT PRACTICE
 The
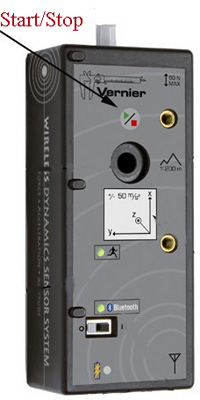
latest device from Vernier is the WDSS. With the
accelerometer and the altimeter built into the unit, there is no
need for a nest of cables. Connection to the computer is done
through radio, although the range is limited to approximately 20
meters.
The
latest device from Vernier is the WDSS. With the
accelerometer and the altimeter built into the unit, there is no
need for a nest of cables. Connection to the computer is done
through radio, although the range is limited to approximately 20
meters.
In practice, the WDSS is programmed to collect data for a period of time at a given rate. It is then disconnected from the computer and the students take it to the ride where they press the Start/Stop button when the ride begins to initiate data collection. Pressing the button a second time stops the collection. WDSS can then be taken to a second ride and data collected from that one, too.
 In
order to meet the needs of the park and protect the equipment, a
piece of foam has been cut to just fit inside the DataVest pocket.
The WDSS is positioned so the Start/Stop button and indicator
lights are visible through the clear plastic window.
In
order to meet the needs of the park and protect the equipment, a
piece of foam has been cut to just fit inside the DataVest pocket.
The WDSS is positioned so the Start/Stop button and indicator
lights are visible through the clear plastic window.
Click here for a short pdf document showing how to carry the WDSS unit in a DataVest.
LABQUEST ARRIVES
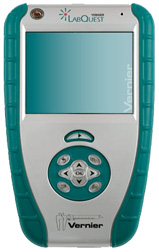 Vernier's
newest data collection device, LabQuest, is now available so we
expect it to show up at amusement parks around the country soon.
A page of general
instructions has been assembled to give guidance to
teachers and students who wish to use a LabQuest at their
amusement park or other venue.
Vernier's
newest data collection device, LabQuest, is now available so we
expect it to show up at amusement parks around the country soon.
A page of general
instructions has been assembled to give guidance to
teachers and students who wish to use a LabQuest at their
amusement park or other venue.
It is anyone's guess what the next stage of evolution will be, but we can be sure that Great America will be one of the testing grounds for it when things develop.
OPERATION WITH
CALCULATOR
In general, the following steps occur:
- We connect the accelerometer probe to the interface and place it inside a case or vest.
- A calculator program, PHYSICS or DATAMATE, is run to instruct the interface to collect data according to a predetermined pattern.
- Students take the interface with its accelerometer to the ride.
- On the ride, the student presses the [TRIGGER] button on the original CBL or the [START/STOP] button on CBL2/LabPro to begin data collection.
- At the end of the ride, the unit is returned so the data can be downloaded into a computer for graphing and interpretation.
Specific step-by-step instructions for this process are given as an appendix to the pdf file Data Collection at the Amusement Park which can be downloaded from this web site.
DOWNLOADING
a program for graphing called Graphical Analysis, also from Vernier Software & Technology, can be used or Logger Pro. Using a TI-Graph Link from Texas Instruments, the data is transfered to the computer and into data columns. Data can then be plotted one column vs. another. Graphical Analysis is available for both Windows and Mac, and at this point there are no differences in the way the program works.
When the data is imported, it isn't labeled. The orientation of the accelerometer during the ride is crucial to determining if you are looking at vertical, lateral or longitudinal acceleration. The column where the numbers get progressively and evenly larger as you go down is almost surely the time column. Learning how to determine which axis is which is important to making correct analyses of the results.

OPERATION WITH COMPUTER
Specific step-by-step instructions for this process are given as an appendix to the pdf file Data Collection at the Amusement Park which can be downloaded from this web site. This version includes instructions for LabPro, but will be updated soon with instructions for WDSS.This general process is used with a LabPro and a computer. The computer can be a laptop or a desktop computer, Macintosh or PC:
- The LabPro is connected to the computer using a serial or USB cable.
- Logger Pro is opened up on the computer, and a file that has been designed to use the accelerometer and/or barometer is launched. Four specific files are available for download from the Vernier Software web site.
- Any changes in data collection rate, time for collecting data, or number of channels to watch are made.
- Under Experiment, choose Remote, then Set up LabPro. By pressing "Okay", the LabPro is set up for remote logging.
- Disconnect the LabPro, go to the ride, once on the ride, press [Start/Stop] once to initiate data collection.
- Return to the computer to download the data which was collected.
DOWNLOADING
- Re-connect the LabPro to the computer using the serial or USB cable. The symbol for the LabPro should show up above the menubar.
- A window will appear giving you a choice of downloading the data. Of course you wish to and proceed according to the online instructions.
- Analyze, save and print. Enjoy!
SETTING UP AN ELECTRONIC DATA CENTER
A page with some basic instructions on setting up an EDC at your park are given. If questions arise, contact the webmaster for this site, or Vernier Software & Technology for assistance.
Updated 2/02/08
And this is still being worked on as we speak!